Business Overview
Prod.net is an online retailer selling a defined product range across English speaking and European markets. Standard direct to consumer economics. Moderate average order value, real repeat purchase potential, and margins that are sensitive to what it costs to acquire a customer.
The Challenge
The account was spending across Search, Shopping and paid social with no separation between people who already knew the brand and people who did not. The reported return looked acceptable, so nothing appeared to be wrong.
Almost all of that return came from brand demand the business already owned. New customer acquisition was losing money underneath it, and the blended number made that invisible. This is the single most common way a growing ecommerce brand stalls. It cannot tell the difference between harvesting demand and creating it.
Objectives
- Separate brand from non-brand so the true cost of a new customer becomes visible
- Make non-brand acquisition profitable on its own terms
- Scale spend without lifting cost per acquisition
- Build reporting the owner can act on rather than interpret
Initial Metrics
| Metric | Before |
|---|---|
| Blended return on ad spend | 2.4x |
| Non-brand return on ad spend | 1.2x |
| Brand return on ad spend | Above 9x |
| New customer share of revenue | Under 40 percent |
| Cost per acquisition trend | Rising month on month |
Audit Findings
- Brand and non-brand keywords shared campaigns and budgets, which meant brand revenue was quietly subsidising non-brand waste.
- Broad match keywords were running with no negative keyword structure, pulling research and comparison traffic into conversion campaigns.
- Shopping ran as a single campaign at a single priority, so there was no mechanism to push high margin products ahead of low margin ones.
- Conversion tracking counted every event at the same weight, including newsletter sign ups, so the bid strategies were optimising toward the cheapest possible action rather than a sale.
- Remarketing sat inside prospecting campaigns, which inflated the reported prospecting return and hid the real cost of cold traffic.
Strategy
Rebuild the account so that every campaign answers one question. Is this new demand or existing demand? Once that line is drawn, each side can be priced separately, and the business can decide how much it is willing to pay for growth rather than being told an average.
Campaign Structure
- Brand campaigns isolated on exact and phrase match with their own budget and their own reporting line
- Non-brand split by intent stage into category terms, product terms and problem terms, because those three groups convert at completely different rates and should never share a target
- Shopping restructured with priority tiers so high margin ranges had first claim on budget
- Remarketing pulled out entirely, reported separately, and excluded from prospecting audiences so prospecting numbers became honest
- Meta run as broad prospecting with catalogue remarketing beneath it, judged on click attribution only
Bidding Strategy
Brand campaigns were capped, because there is no point paying to protect demand you already own beyond the point of diminishing return. Non-brand ran on target cost per acquisition set against contribution margin rather than revenue. Shopping used priority tiers so margin, not volume, decided which products got exposure.
Tracking Improvements
Conversion actions were reweighted so purchase with value became the only primary conversion and every micro action was demoted to secondary. GA4 and Google Tag Manager were rebuilt so that channel reporting inside analytics matched platform reporting. When those two disagree, every optimisation decision after that point is a guess.
Optimization Process
Weekly search term and negative keyword work. Monthly margin review by product tier, so budget followed contribution rather than revenue. Creative testing on a fixed cadence with one variable changed at a time, because testing two variables at once produces a result you cannot reuse.
Scaling Process and Budget Changes
Budget was increased only where cost per acquisition held for two consecutive weeks. Non-brand budget moved up in 20 percent steps rather than doubling, so bid strategies were never thrown back into learning. Slow scaling looks conservative and it consistently beats aggressive scaling over a quarter.
Results
| Metric | Before | After |
|---|---|---|
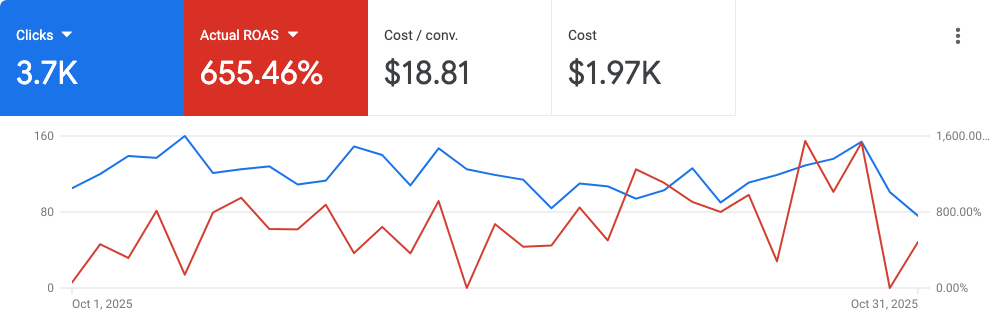
| Blended return on ad spend | 2.4x | 6x |
| Non-brand return on ad spend | 1.2x | 3.5x |
| New customer share of revenue | Under 40 percent | Above 60 percent |
| Cost per acquisition | Rising | Down approximately 40 percent |
| Monthly spend | Flat | Increased with no loss of efficiency |
Key Learnings
A healthy blended return often hides an unprofitable acquisition engine. Split the account before you judge it.
Brand demand is not growth. It is demand you already earned and are now paying to collect.
Scale in steps the bid strategy can learn from. Doubling a budget resets the learning you paid for.
Margin should decide which products get budget. Revenue is a vanity measure at the SKU level.
Final Business Impact
The business could finally see what a new customer costs, which meant it could spend into growth with confidence instead of guessing. Six times return on a properly separated account is a different asset to six times return on an account that is mostly brand traffic.
Figures are drawn from the platform and analytics reporting for each account in the period stated.
A diagnosis, not a pitch.
Bring the account, the numbers and the problem as you understand it. You leave knowing where the broken link is, whether or not we work together.
A read on where your growth ceiling actually sits, across all six parts of the system.
Which of frequency, measurement or structure is costing you the most right now.
What fixing it would take. Scope, sequence and who does what.
A straight answer on whether I am the right person to own it.
Thirty minutes, held on Google Meet. The link is in the calendar invitation.